Learning intentions
Students will:
- choose appropriate ways to represent a dataset, considering the impact, and their audience
- compare different types of data visualisations, including graphs and infographics.
Success criteria
Students can:
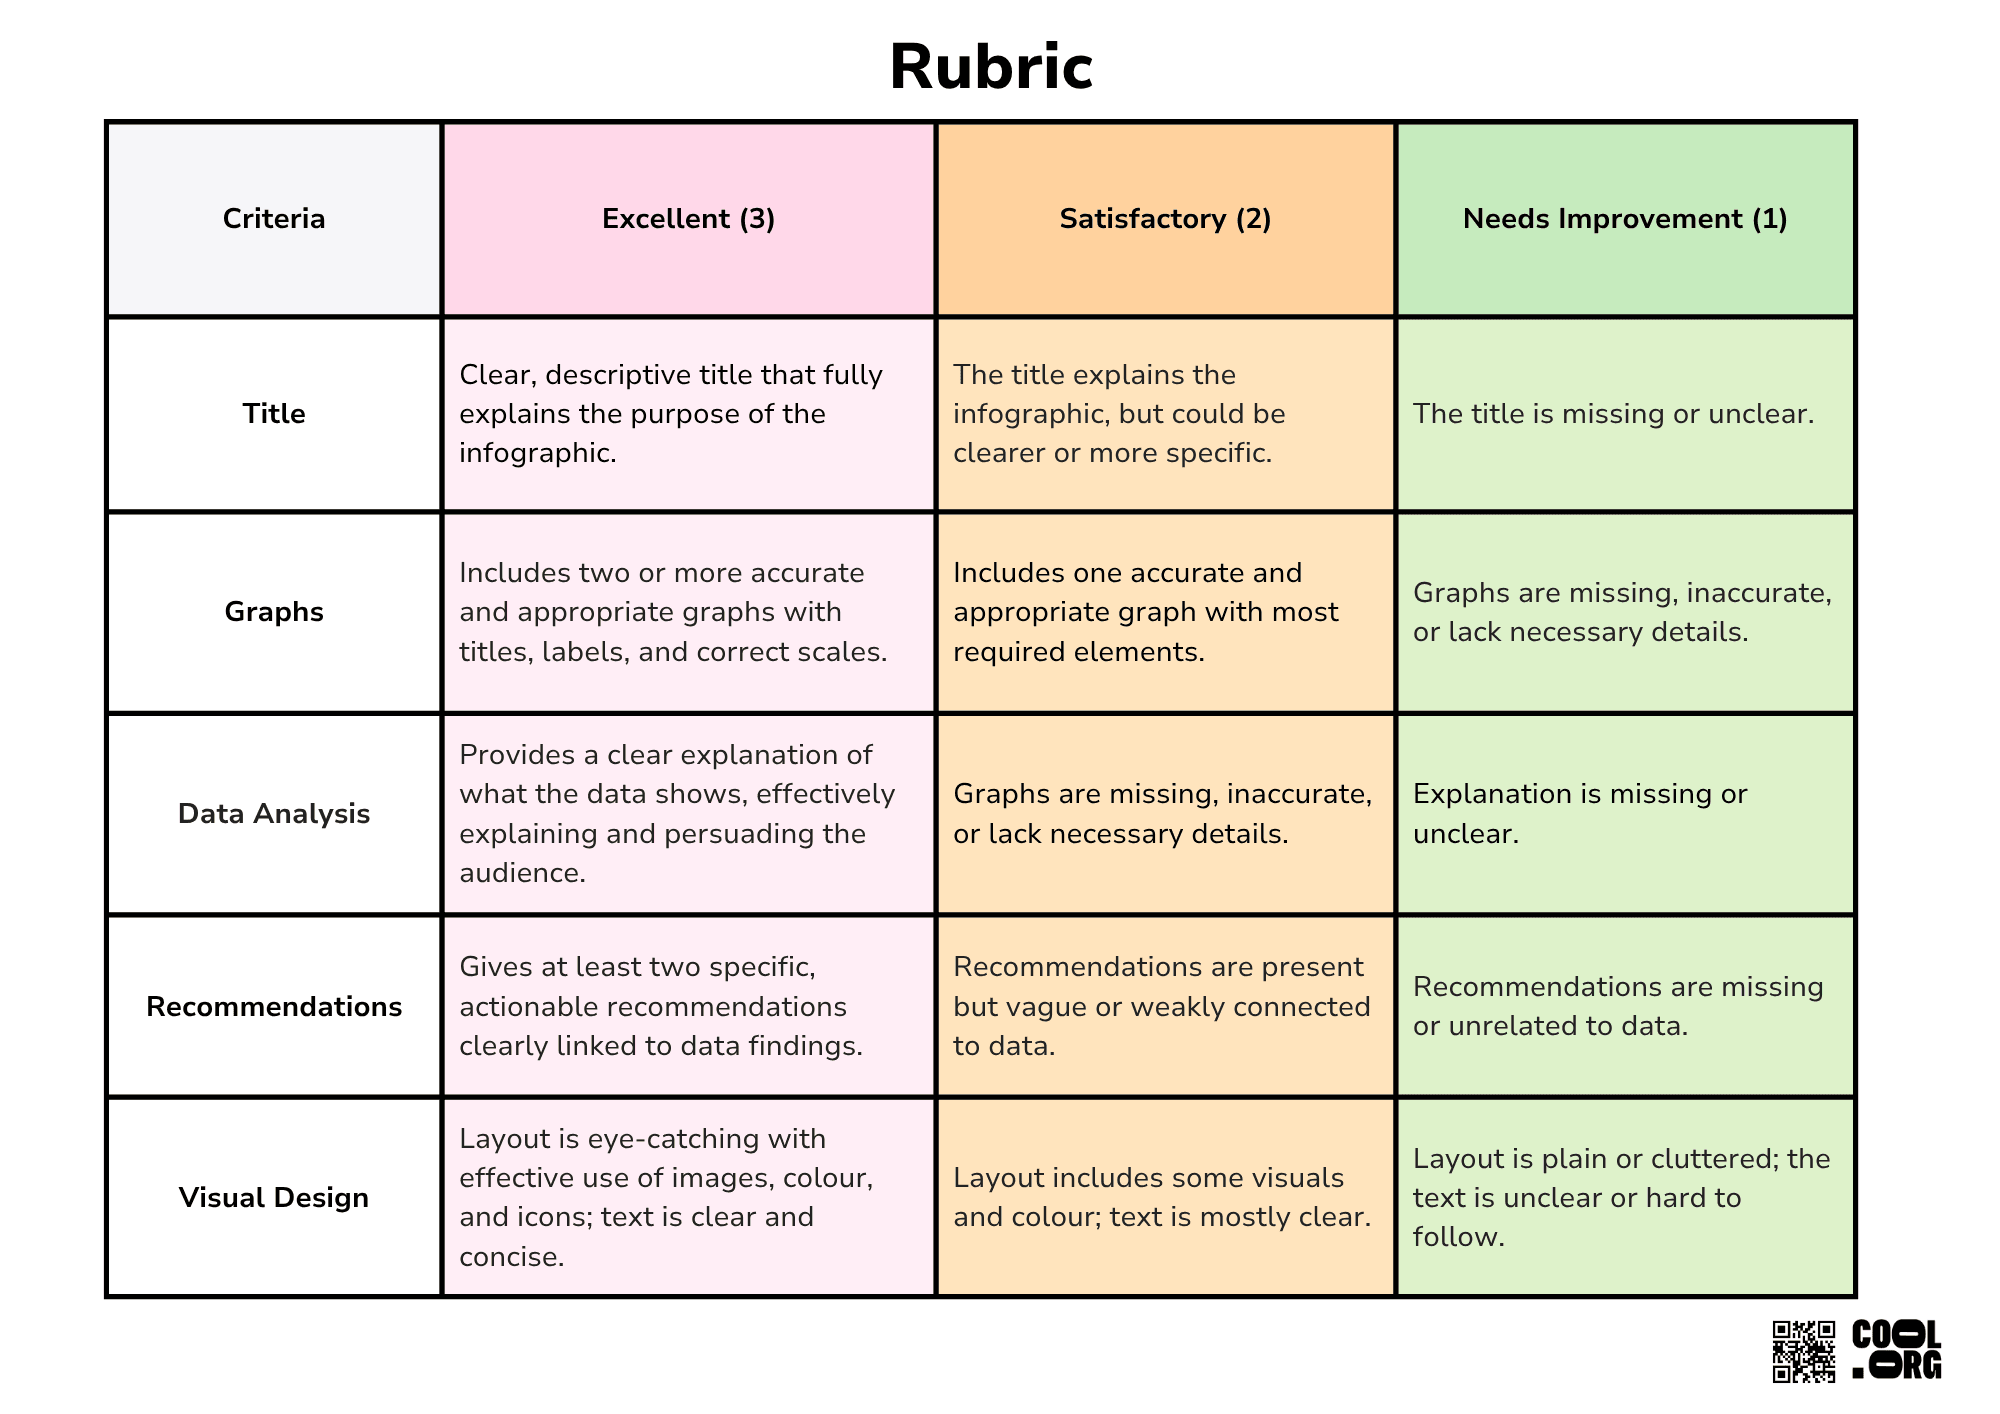
- choose and create a suitable data visualisation (graph/chart/infographic) based on a given dataset and audience.