Lesson summary
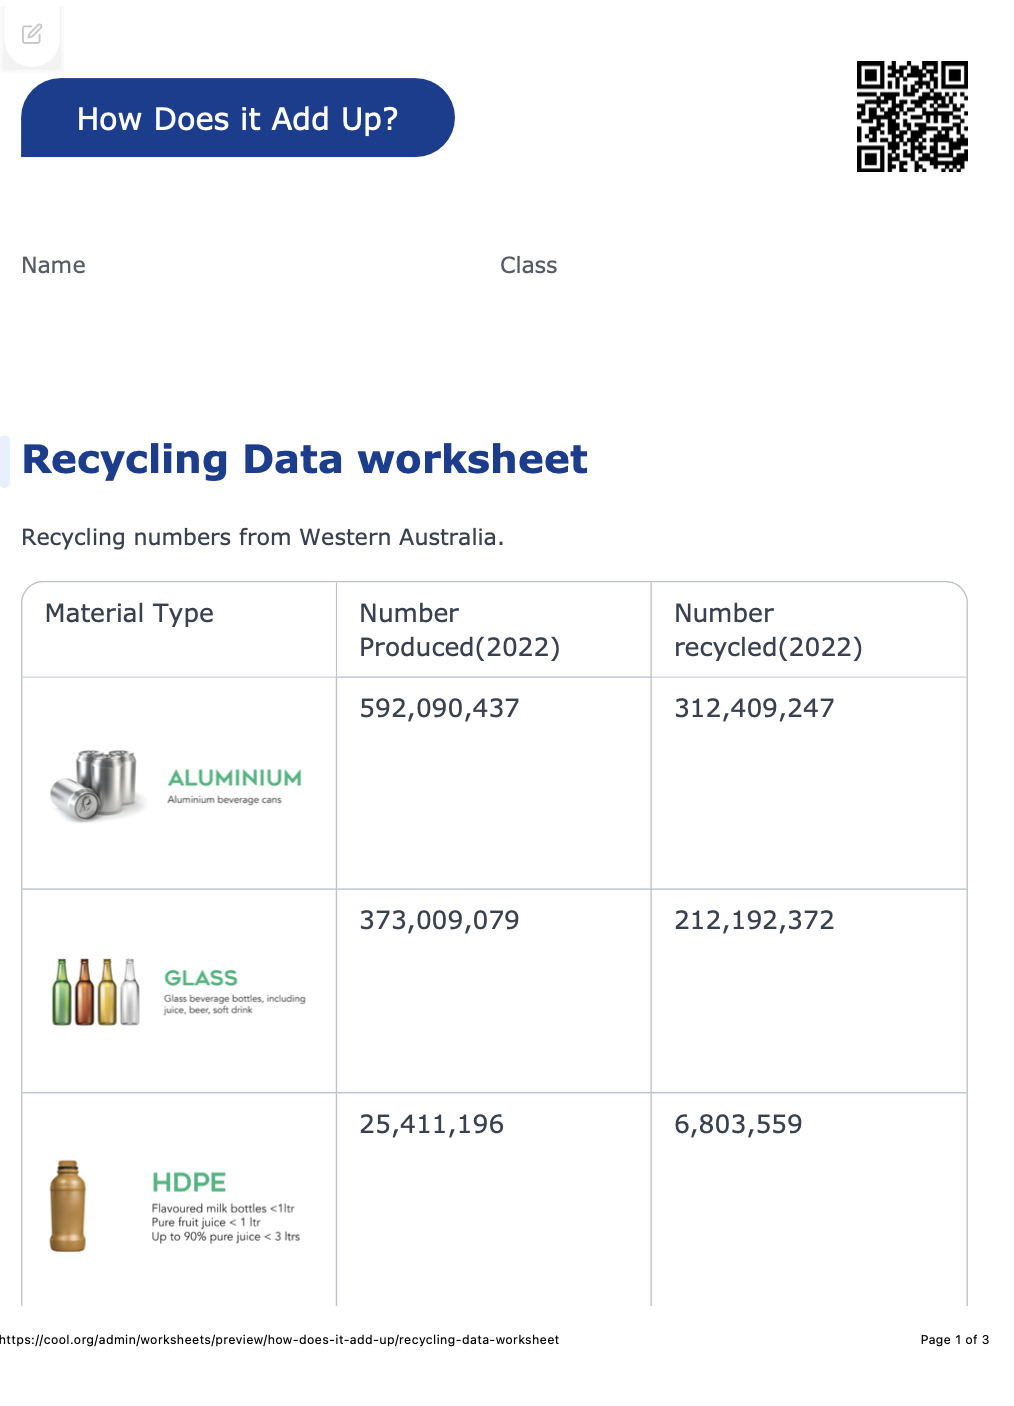
How do our recycling habits compare to the products that are being produced? Through creating data displays with digital technologies students will aim to answer this question using data provided through the Western Australia Containers for Change Initiative.
Learning intentions:
Students will...
- present and analyse data to form conclusions.
Success criteria:
Students can...
- select suitable graphs to display data about recycling in each region of Western Australia
- identify key trends reflected in the data displays
- use the data to identify answers to specific investigation questions
- compare sets of data to form conclusions.
Lesson guides and printables
Curriculum links
Select your curriculum from the options below.
Lesson details
Skills
This lesson is designed to build students’ competencies in the following skills:
- critical thinking
- communication
- curiosity
- digital literacy
- reflection
Curriculum Mapping
Western Australian Curriculum - Year 5, Mathematics
- Construct displays, including column graphs, dot plots and tables, appropriate for data type, with and without the use of digital technologies (ACMSP119)
Australian Curriculum (v9.0) content descriptions - Mathematics
- Students acquire, and represent data to address a question of interest or purpose using software including spreadsheets; discuss and report on data distributions (AC9M5ST01)
General capabilities: Digital Literacy, Numeracy
Cross-curriculum priority: Sustainability
Relevant parts of Year 5 achievement standards: Students plan and conduct statistical investigations that collect nominal and ordinal categorical and discrete numerical data using digital tools.
Western Australian Curriculum - Year 5, Mathematics
- Construct displays, including column graphs, dot plots and tables, appropriate for data type, with and without the use of digital technologies (ACMSP119)
UN Sustainable Development Goals
UN SDG 12: Ensure sustainable consumption and production patterns.
Target 12.5: By 2030, substantially reduce waste generation through prevention, reduction, recycling and reuse.
Resources Required
- Computers or tablets with access to spreadsheets and compatible word-processing software (one per student)
- Device to display videos, digital resources and demonstrate how to create charts using spreadsheet software
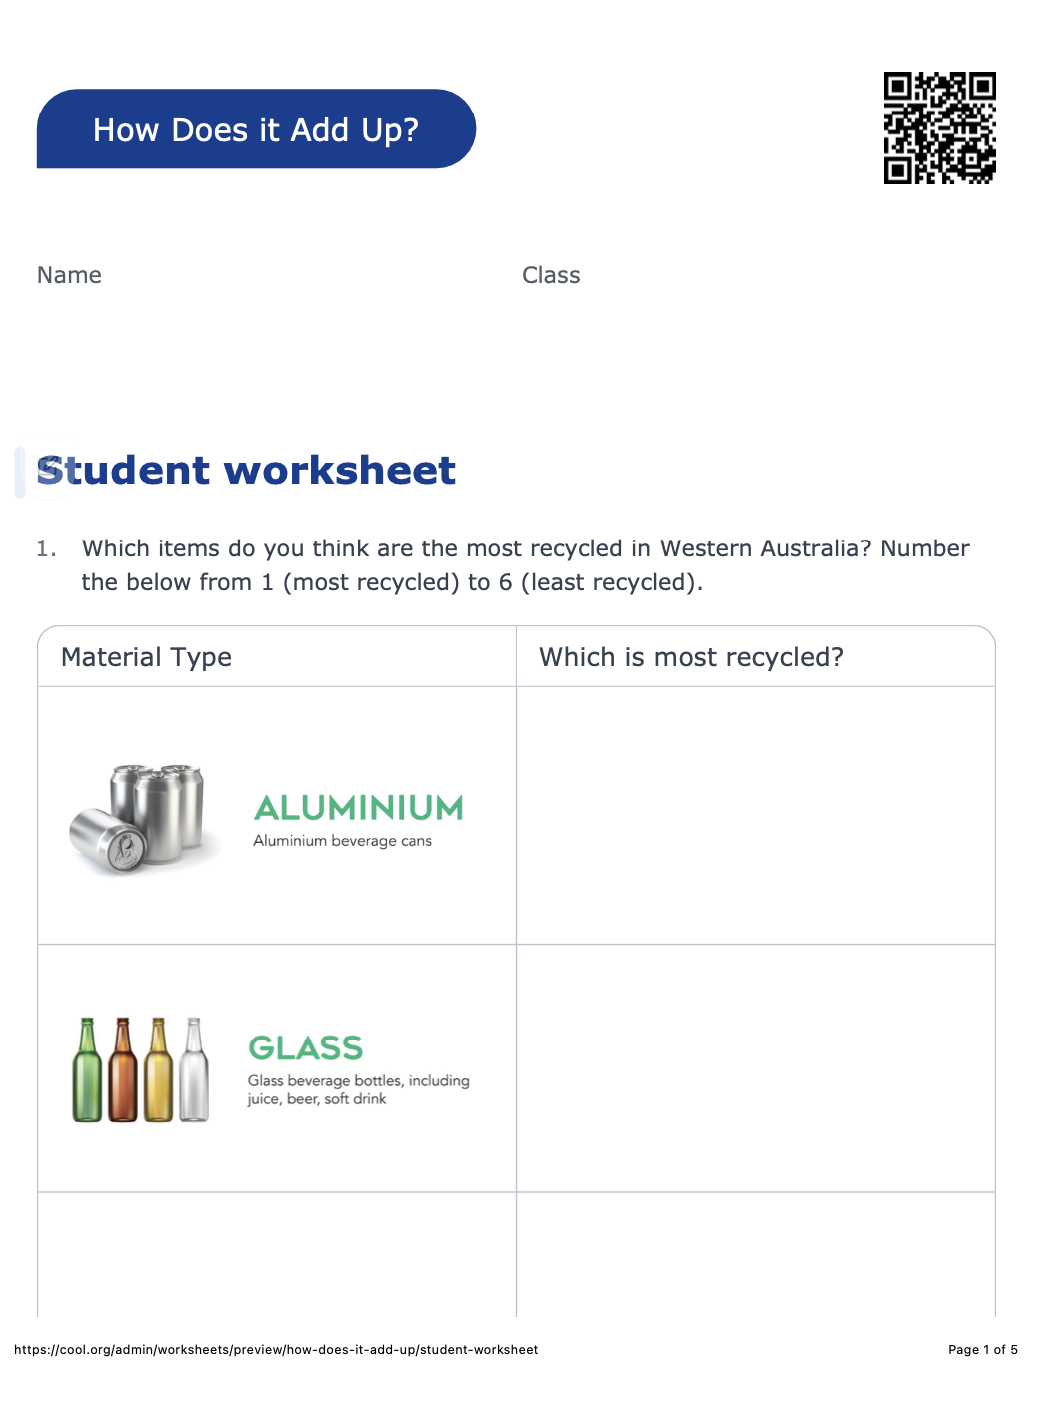
- Student Worksheet: Graphing Our Recycling (one between two)
- Student Resource Sheet: Recycling Data (one between two)
Additional Info
Level of teacher scaffolding: High - This lesson draws upon a range of mathematical and digital skills. It is important for the teacher to remain actively involved in the lesson to support students.
Welcome back!
Don't have an account yet?
Log in with:
Create your free Cool.org account.
Many of our resources are free, with an option to upgrade to Cool+ for premium content.
Already have an account?
Sign up with:
By signing up you accept Cool.org's Terms and Conditions(Opens in new tab) and Privacy Policy(Opens in new tab).