Lesson summary
What are the chances of a person in Australia experiencing poverty? It might be higher than you think, with a range of factors potentially contributing to their income being less than half of the Australian median income.
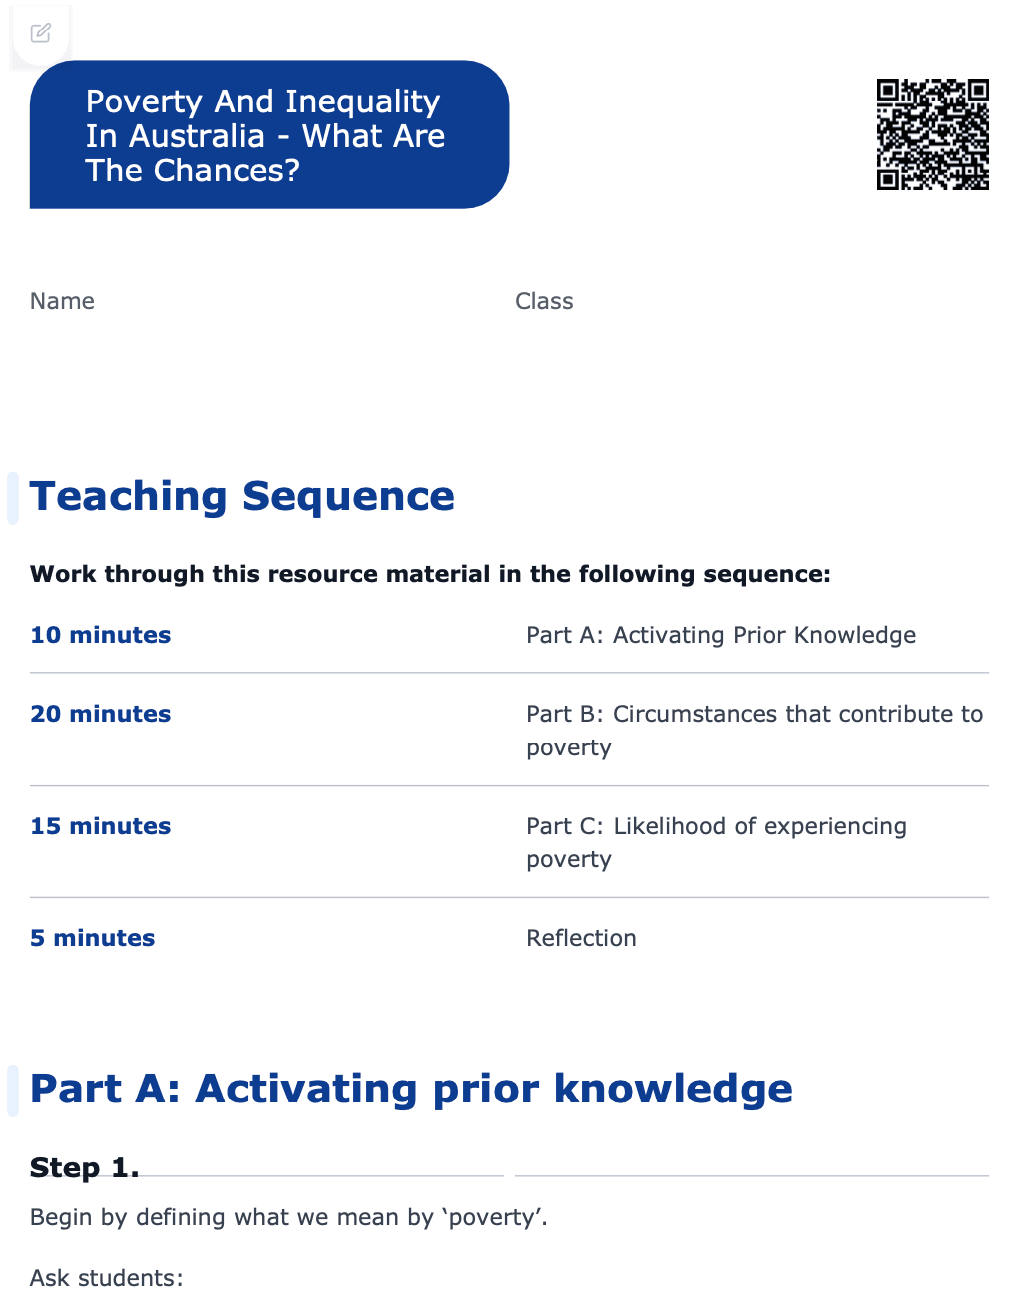
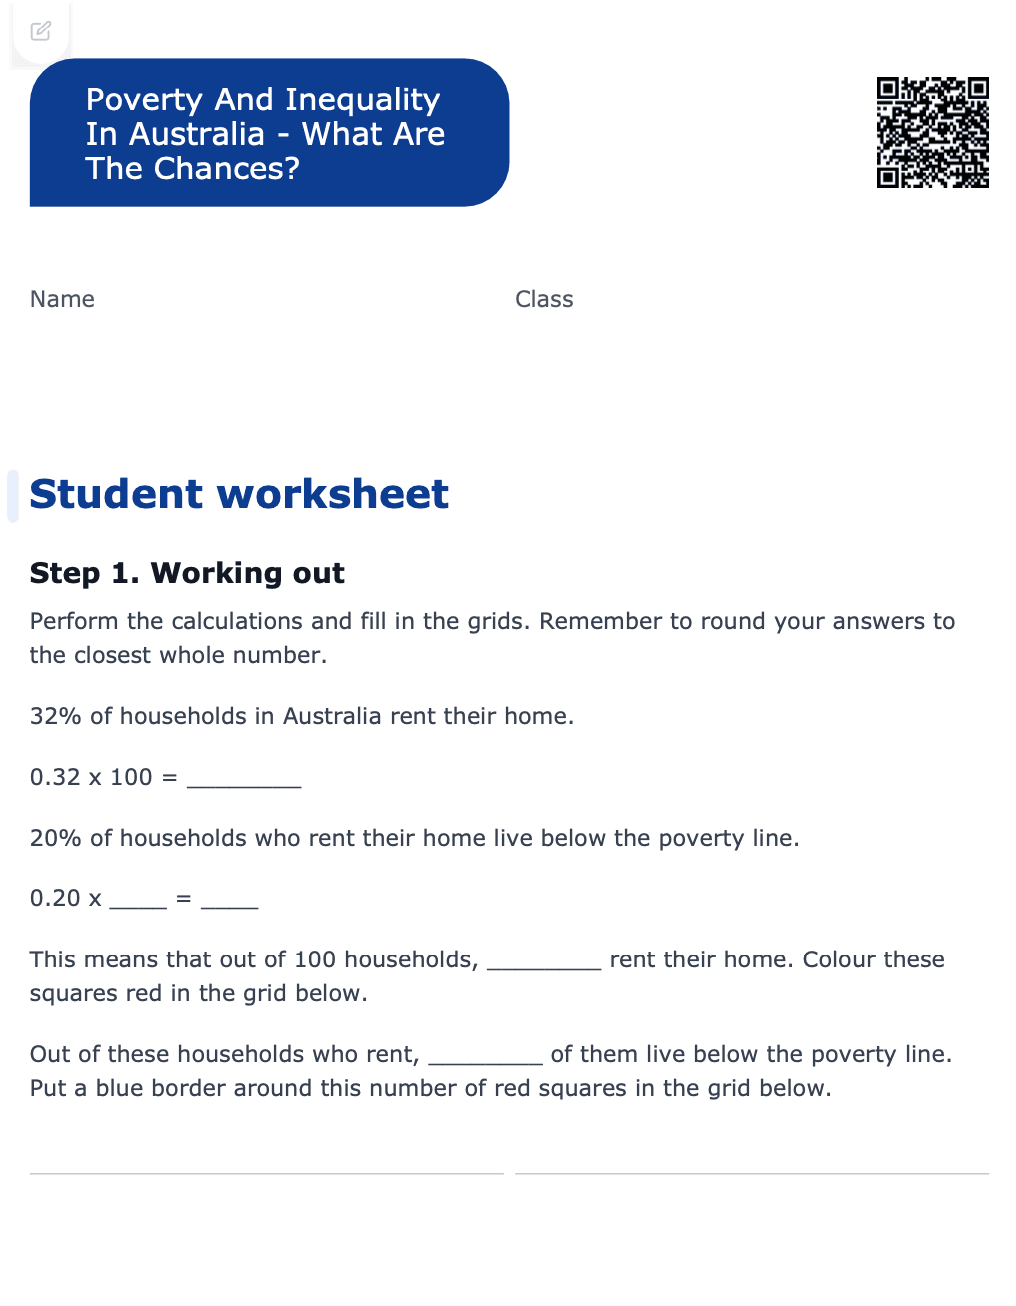
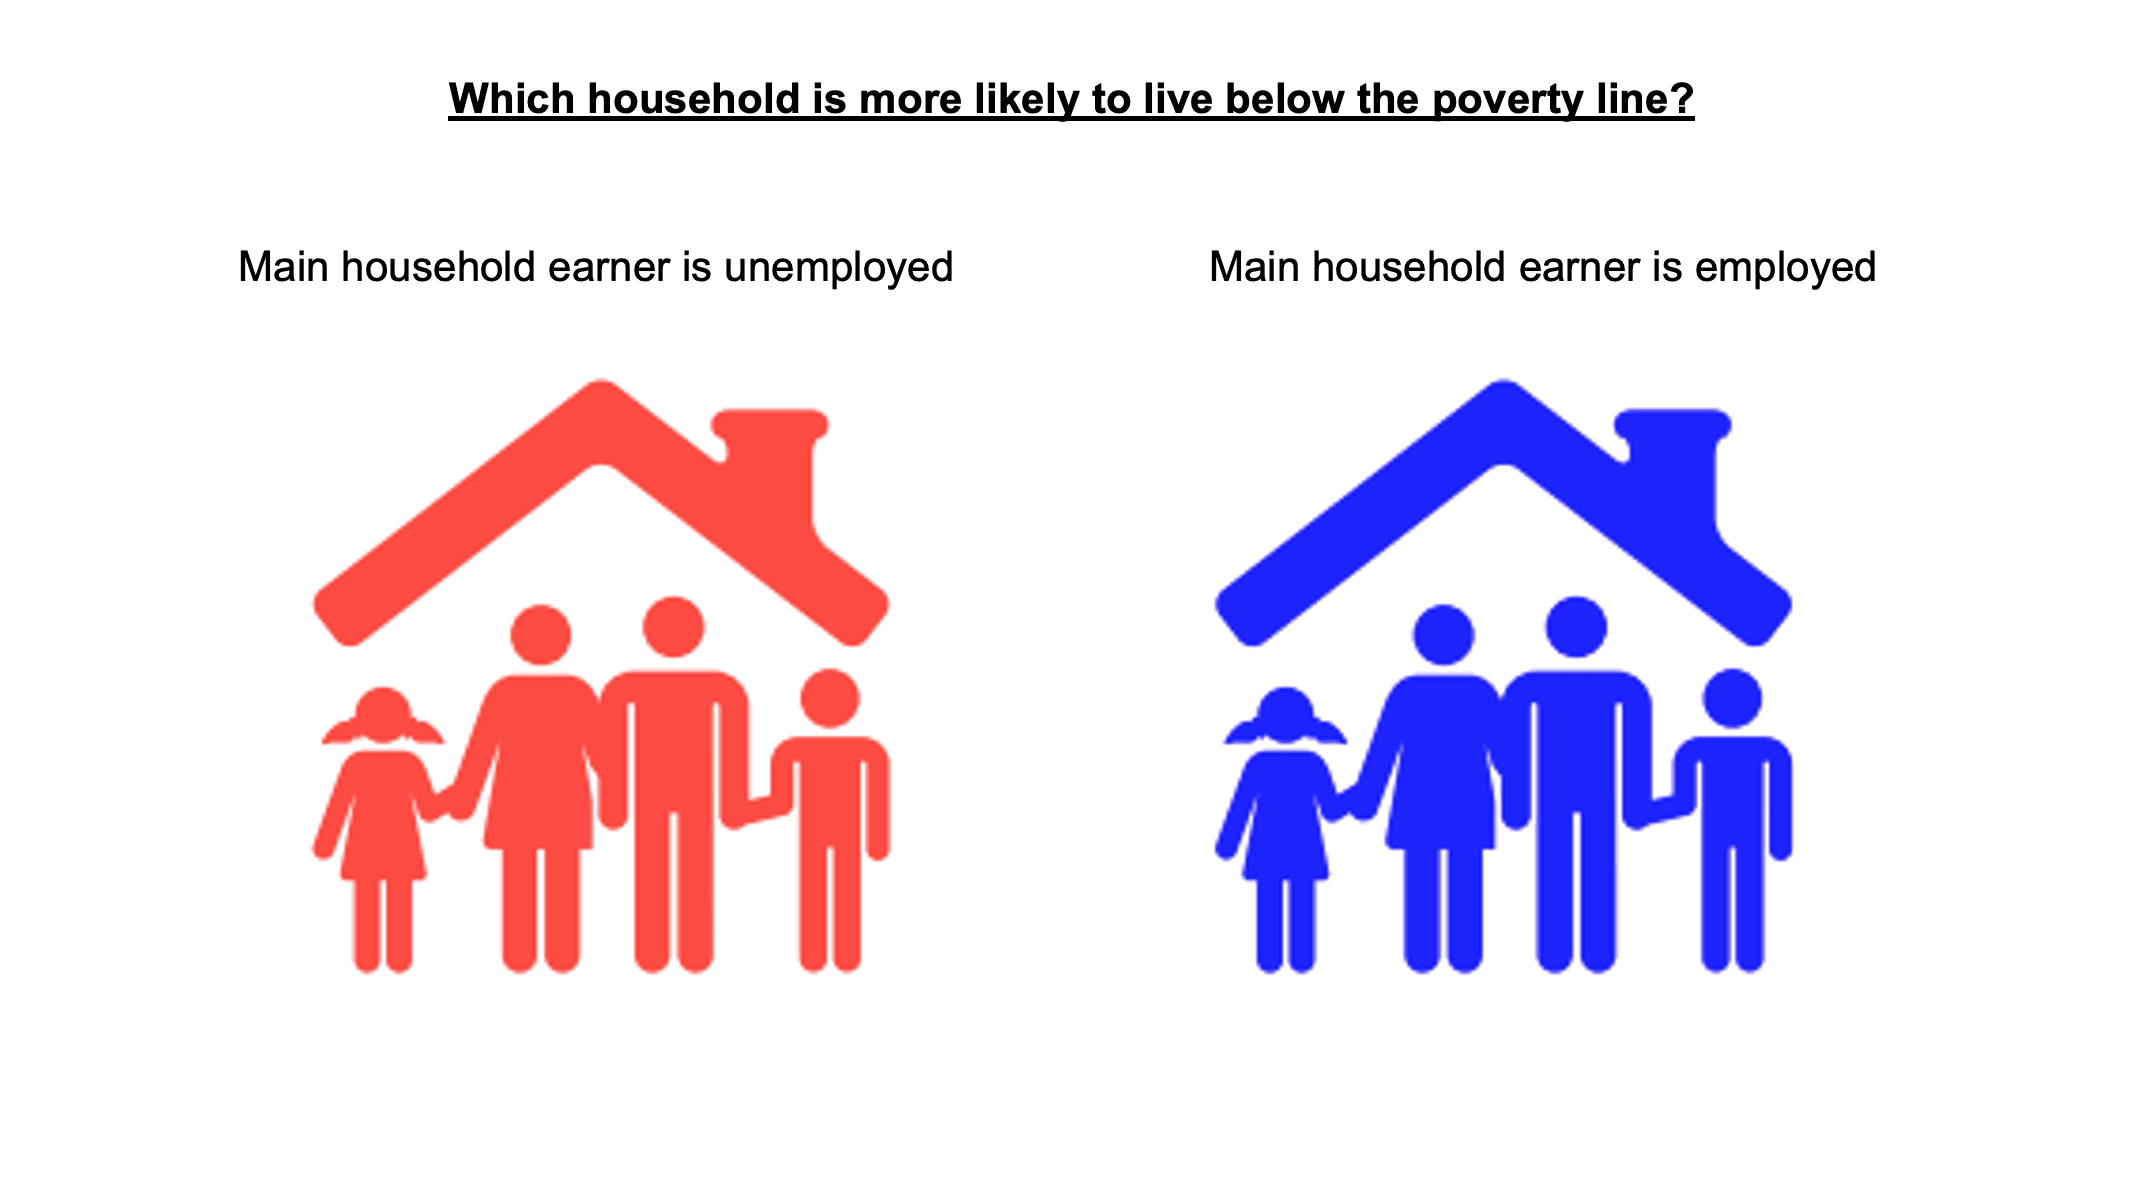
This lesson will introduce students to the data of people living below the poverty line in Australia. Students will consider a range of factors that increase people’s and family’s likelihood of living below the poverty line and why these factors may contribute to poverty. Students will then perform some simple calculations to determine a person’s or family’s likelihood of experiencing living below the poverty line during their lifetime. Students will reflect on the results, and how these statistics shape or change their perception of poverty and people living below the poverty line in Australia.
Learning intentions:
Students will...
- develop an understanding of the risk of poverty among different groups in the community and some of the barriers they face in overcoming it.
Success criteria:
Students can...
- calculate and interpret the median of a range of numbers
- interpret basic percentages as an expression of part of a population of 100
- interpret data from the Australian Bureau of Statistics in terms of their real-world impact
- perform basic calculations and present data visually to determine rates of poverty in Australian populations.
Lesson guides and printables
Lesson details
Curriculum mapping
Australian Curriculum content descriptions:
Years 7 Mathematics:
- Compare fractions using equivalence. Locate and represent positive and negative fractions and mixed numbers on a number line (ACMNA152)
- Express one quantity as a fraction of another, with and without the use of digital technologies (ACMNA155)
- Round decimals to a specified number of decimal places (ACMNA156)
- Connect fractions, decimals and percentages and carry out simple conversions (ACMNA157)
- Find percentages of quantities and express one quantity as a percentage of another, with and without digital technologies (ACMNA158)
- Assign probabilities to the outcomes of events and determine probabilities for events (ACMSP168)
- Construct and compare a range of data displays including stem-and-leaf plots and dot plots (ACMSP170)
- Describe and interpret data displays using median, mean and range (ACMSP172)
Years 8 Mathematics:
- Solve problems involving the use of percentages, including percentage increases and decreases, with and without digital technologies (ACMNA187)
- Explore the variation of means and proportions of random samples drawn from the same population (ACMSP293)
- Investigate the effect of individual data values, including outliers, on the mean and median (ACMSP207)
Syllabus outcomes: MA3-2WM, MA3-7NA, MA3-18SP, MA3-19SP
General capabilities: Numeracy, Critical and Creative Thinking, Ethical Understanding
Relevant parts of Year 7 achievement standards:
Students solve problems involving percentages and all four operations with fractions and decimals. Students use fractions, decimals and percentages, and their equivalences. They express one quantity as a fraction or percentage of another. Students determine the sample space for simple experiments with equally likely outcomes and assign probabilities to those outcomes.
Relevant parts of Year 8 achievement standards:
Students solve everyday problems involving rates, ratios and percentages. They explain the effect of outliers on means and medians in that data. They simplify a variety of algebraic expressions.
Level of teacher scaffolding: Medium – teachers guide discussion and explain the meaning of probability and other maths concepts, then support students in their independent work
Resources required
- A device capable of presenting a video to the class
- Powerpoint presentation on poverty and inequality
- Student Worksheets – one copy per student
Skills
This lesson is designed to build students’ competencies in the following skills:
- Creativity
- Critical thinking
- Communication
- Digital literacy
- Empathy
- Ethical understanding
- Problem solving
Additional info
Relevant parts of Year 8 achievement standards:
Students solve everyday problems involving rates, ratios and percentages. They explain the effect of outliers on means and medians in that data. They simplify a variety of algebraic expressions.
Time required: 60 mins
These lessons have been designed in consultation with Anti-Poverty Week and ACOSS/UNSW Poverty and Inequality Partnership.
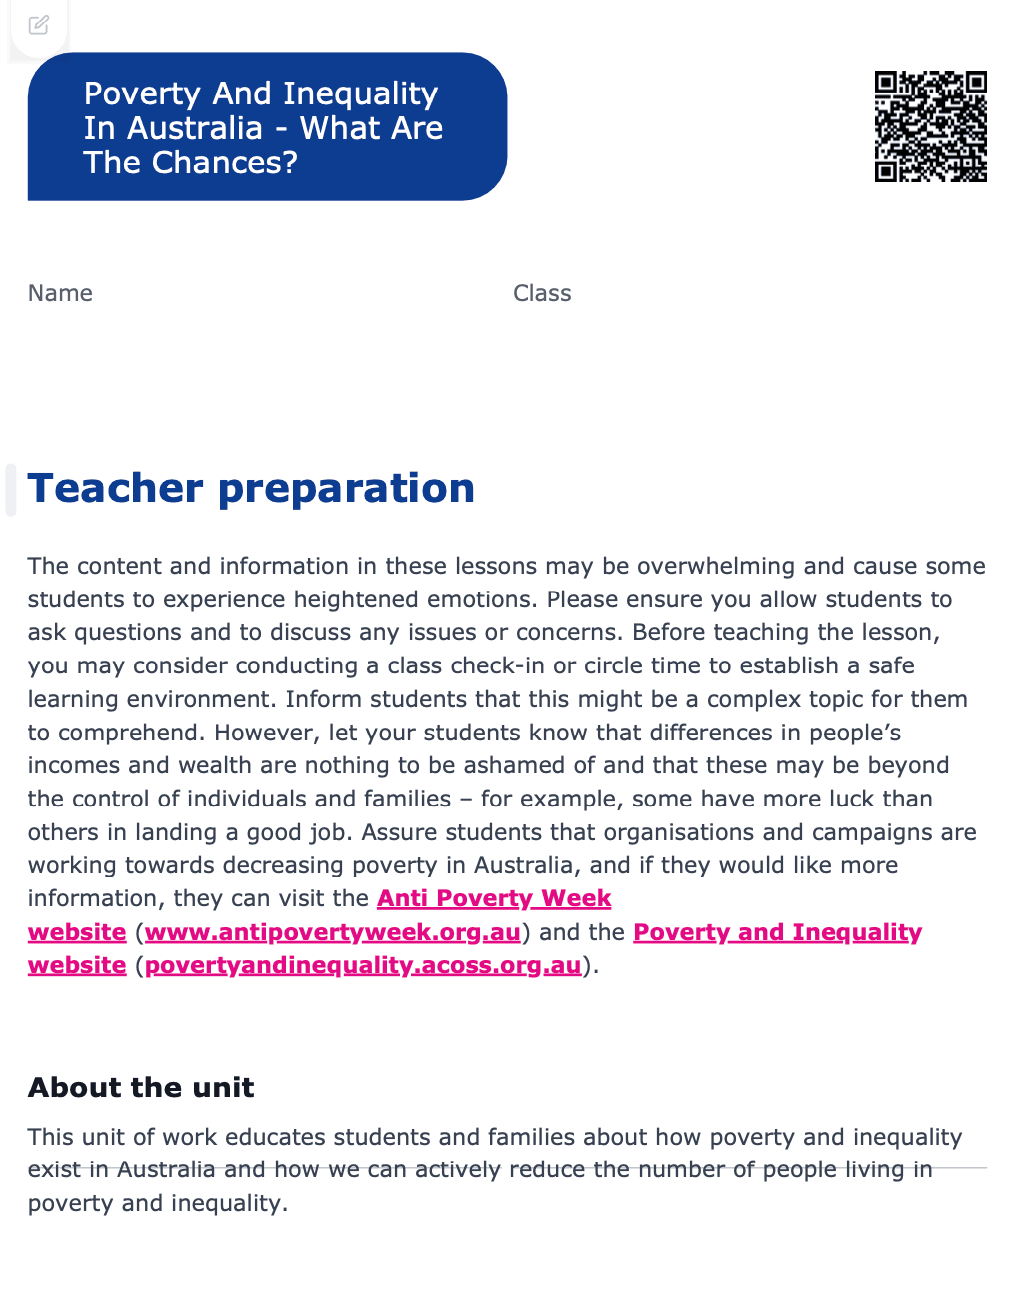
The content and information in these lessons may be overwhelming and cause some students to experience heightened emotions.
Please ensure you allow students to ask questions and to discuss any issues or concerns. Before teaching the lesson, you may consider conducting a class check-in or circle time to establish a safe learning environment. Inform students that this might be a complex topic for them to comprehend. However, let your students know that differences in people’s incomes and wealth are nothing to be ashamed of and that these may be beyond the control of individuals and families – for example, some have more luck than others in landing a good job.
Assure students that organisations and campaigns are working towards decreasing poverty in Australia, and if they would like more information, they can visit the Anti Poverty Week website and the Poverty and Inequality website.
Welcome back!
Don't have an account yet?
Log in with:
Create your free Cool.org account.
Many of our resources are free, with an option to upgrade to Cool+ for premium content.
Already have an account?
Sign up with:
By signing up to Cool.org you consent and agree to Cool's privacy policy to
store, manage and process your personal information. To read more, please see
our privacy policy here(Opens in new tab).