How to use Data to Promote Climate Change Action

  • Cool+
  • Primary
  • Year 5
  • Mathematics
  • Statistics
  • Environmental
  • Climate Change
  • ...

Presentation Summary

There's so much more to line graphs than lines. Discover how line graphs are a starting point for understanding our planet's patterns and how you can take personal action to make a difference in your own backyard.

Accessing the file:
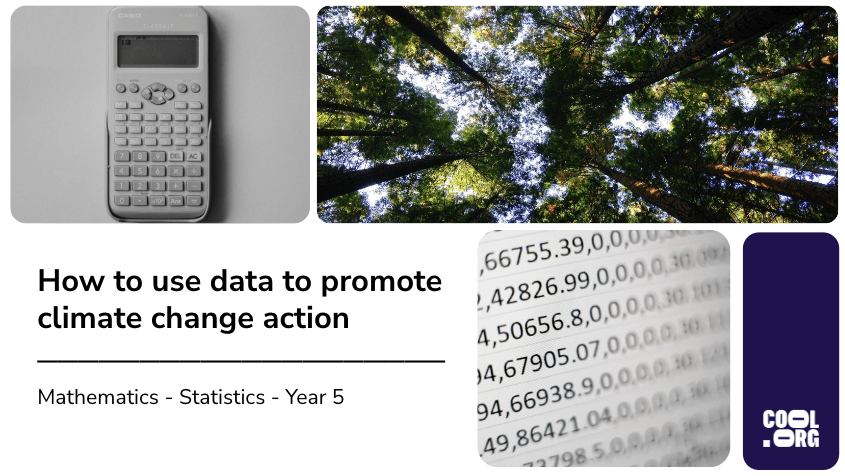
  • Click the 'download' button and choose either Microsoft PowerPoint or Google Slides.
  • Edit the presentation to suit your teaching style.
  • Members must have an active Cool+ subscription to access the presentation.
  • View the entire catalogue of Presentation Slides here.

Curriculum links

  • Interpreting line graphs representing change over time, discuss the relationships that are represented and conclusions that can be made (AC9M5ST02)

Aligned Cool.org resources

presentation saved in resources

Save

Share