Presentation Summary
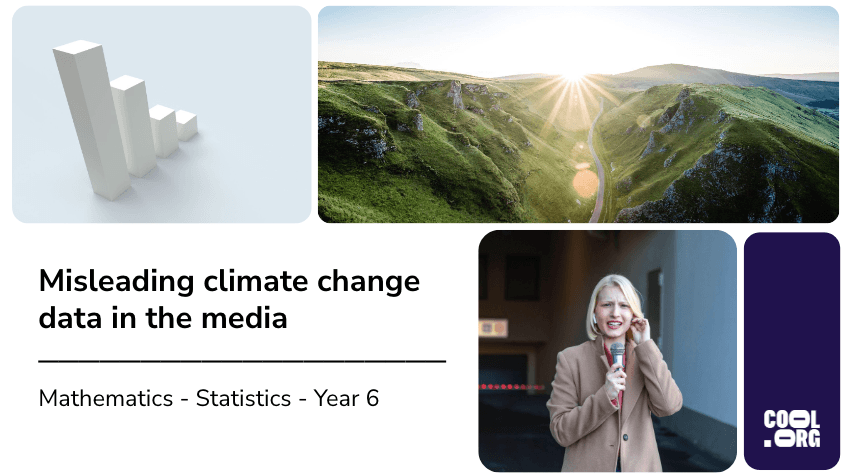
How important is it to understand the full picture of climate change? Selective pieces of information do help us critique the whole story. Discover how graphs and charts can be misleading when information is represented in certain ways.
Accessing the file:
- Click the 'download' button and choose either Microsoft PowerPoint or Google Slides.
- Edit the presentation to suit your teaching style.
- Members must have an active Cool+ subscription to access the presentation.
- View the entire catalogue of Presentation Slides here.
Curriculum links
- Identify statistically informed arguments presented in traditional and digital media; discuss and critique methods, data representations and conclusions (AC9M6ST02)
Aligned Cool.org resources
- Lesson: How does climate change affect food production?
- Self-Directed Lesson: 2040 - Tackling Food Insecurity With Urban Farming
- Lesson: Should we stop eating meat?
- Lesson: Regenerating Australia - Watching the Film

Welcome back!
Don't have an account yet?
Log in with:
Create your free Cool.org account.
Many of our resources are free, with an option to upgrade to Cool+ for premium content.
Already have an account?
Sign up with:
By signing up you accept Cool.org's Terms and Conditions(Opens in new tab) and Privacy Policy(Opens in new tab).