How to Read Graphs

  • Cool+
  • Secondary
  • Year 7
  • Mathematics
  • Numbers
  • Statistics
  • Measurement
  • Graphs and data
  • Social
  • Social Action
  • ...

Presentation Summary

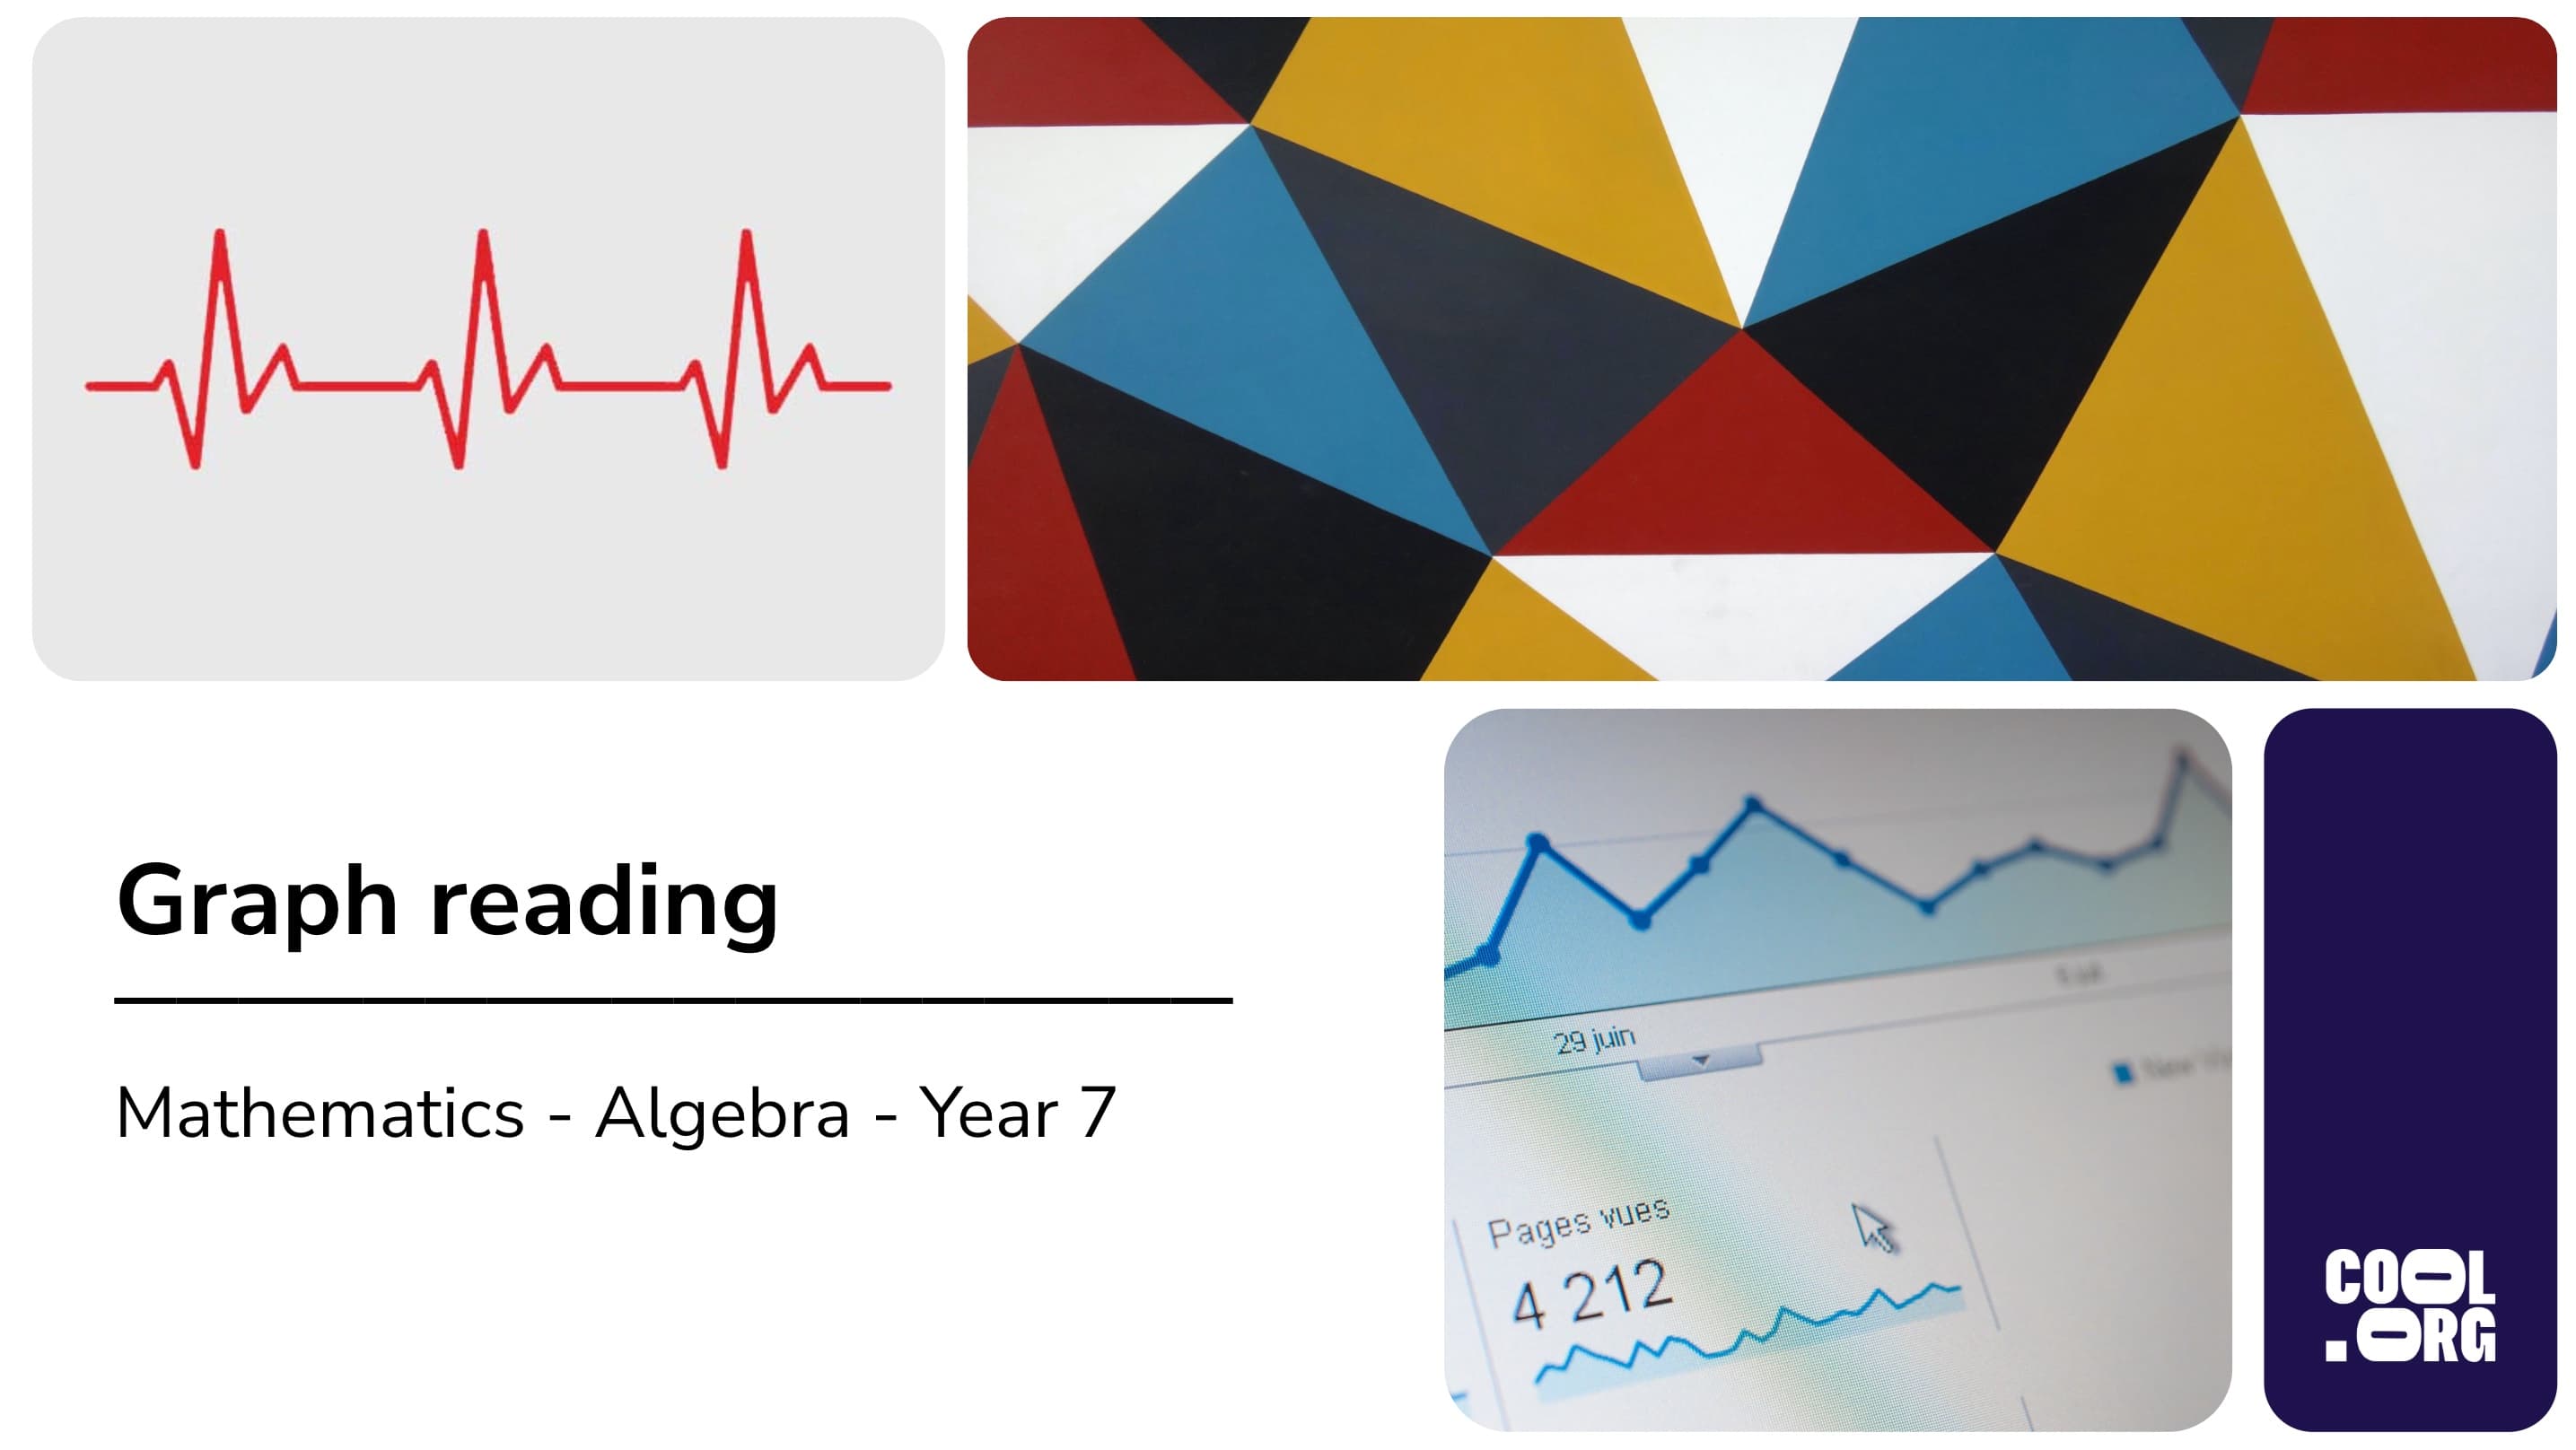
What are the key features of a graph? Some graphs communicate information well and others can even mislead us. Explore how graphs tell a story and be used to make information even more important.

Accessing the file:
  • Click the 'download' button and choose either Microsoft PowerPoint or Google Slides.
  • Edit the presentation to suit your teaching style.
  • Members must have an active Cool+ subscription to access the presentation.
  • View the entire catalogue of Presentation Slides here.

Curriculum links

  • Describe relationships between variables represented in graphs of functions from authentic data (AC9M7A04)

Aligned Cool.org resources

presentation saved in resources

Save

Share