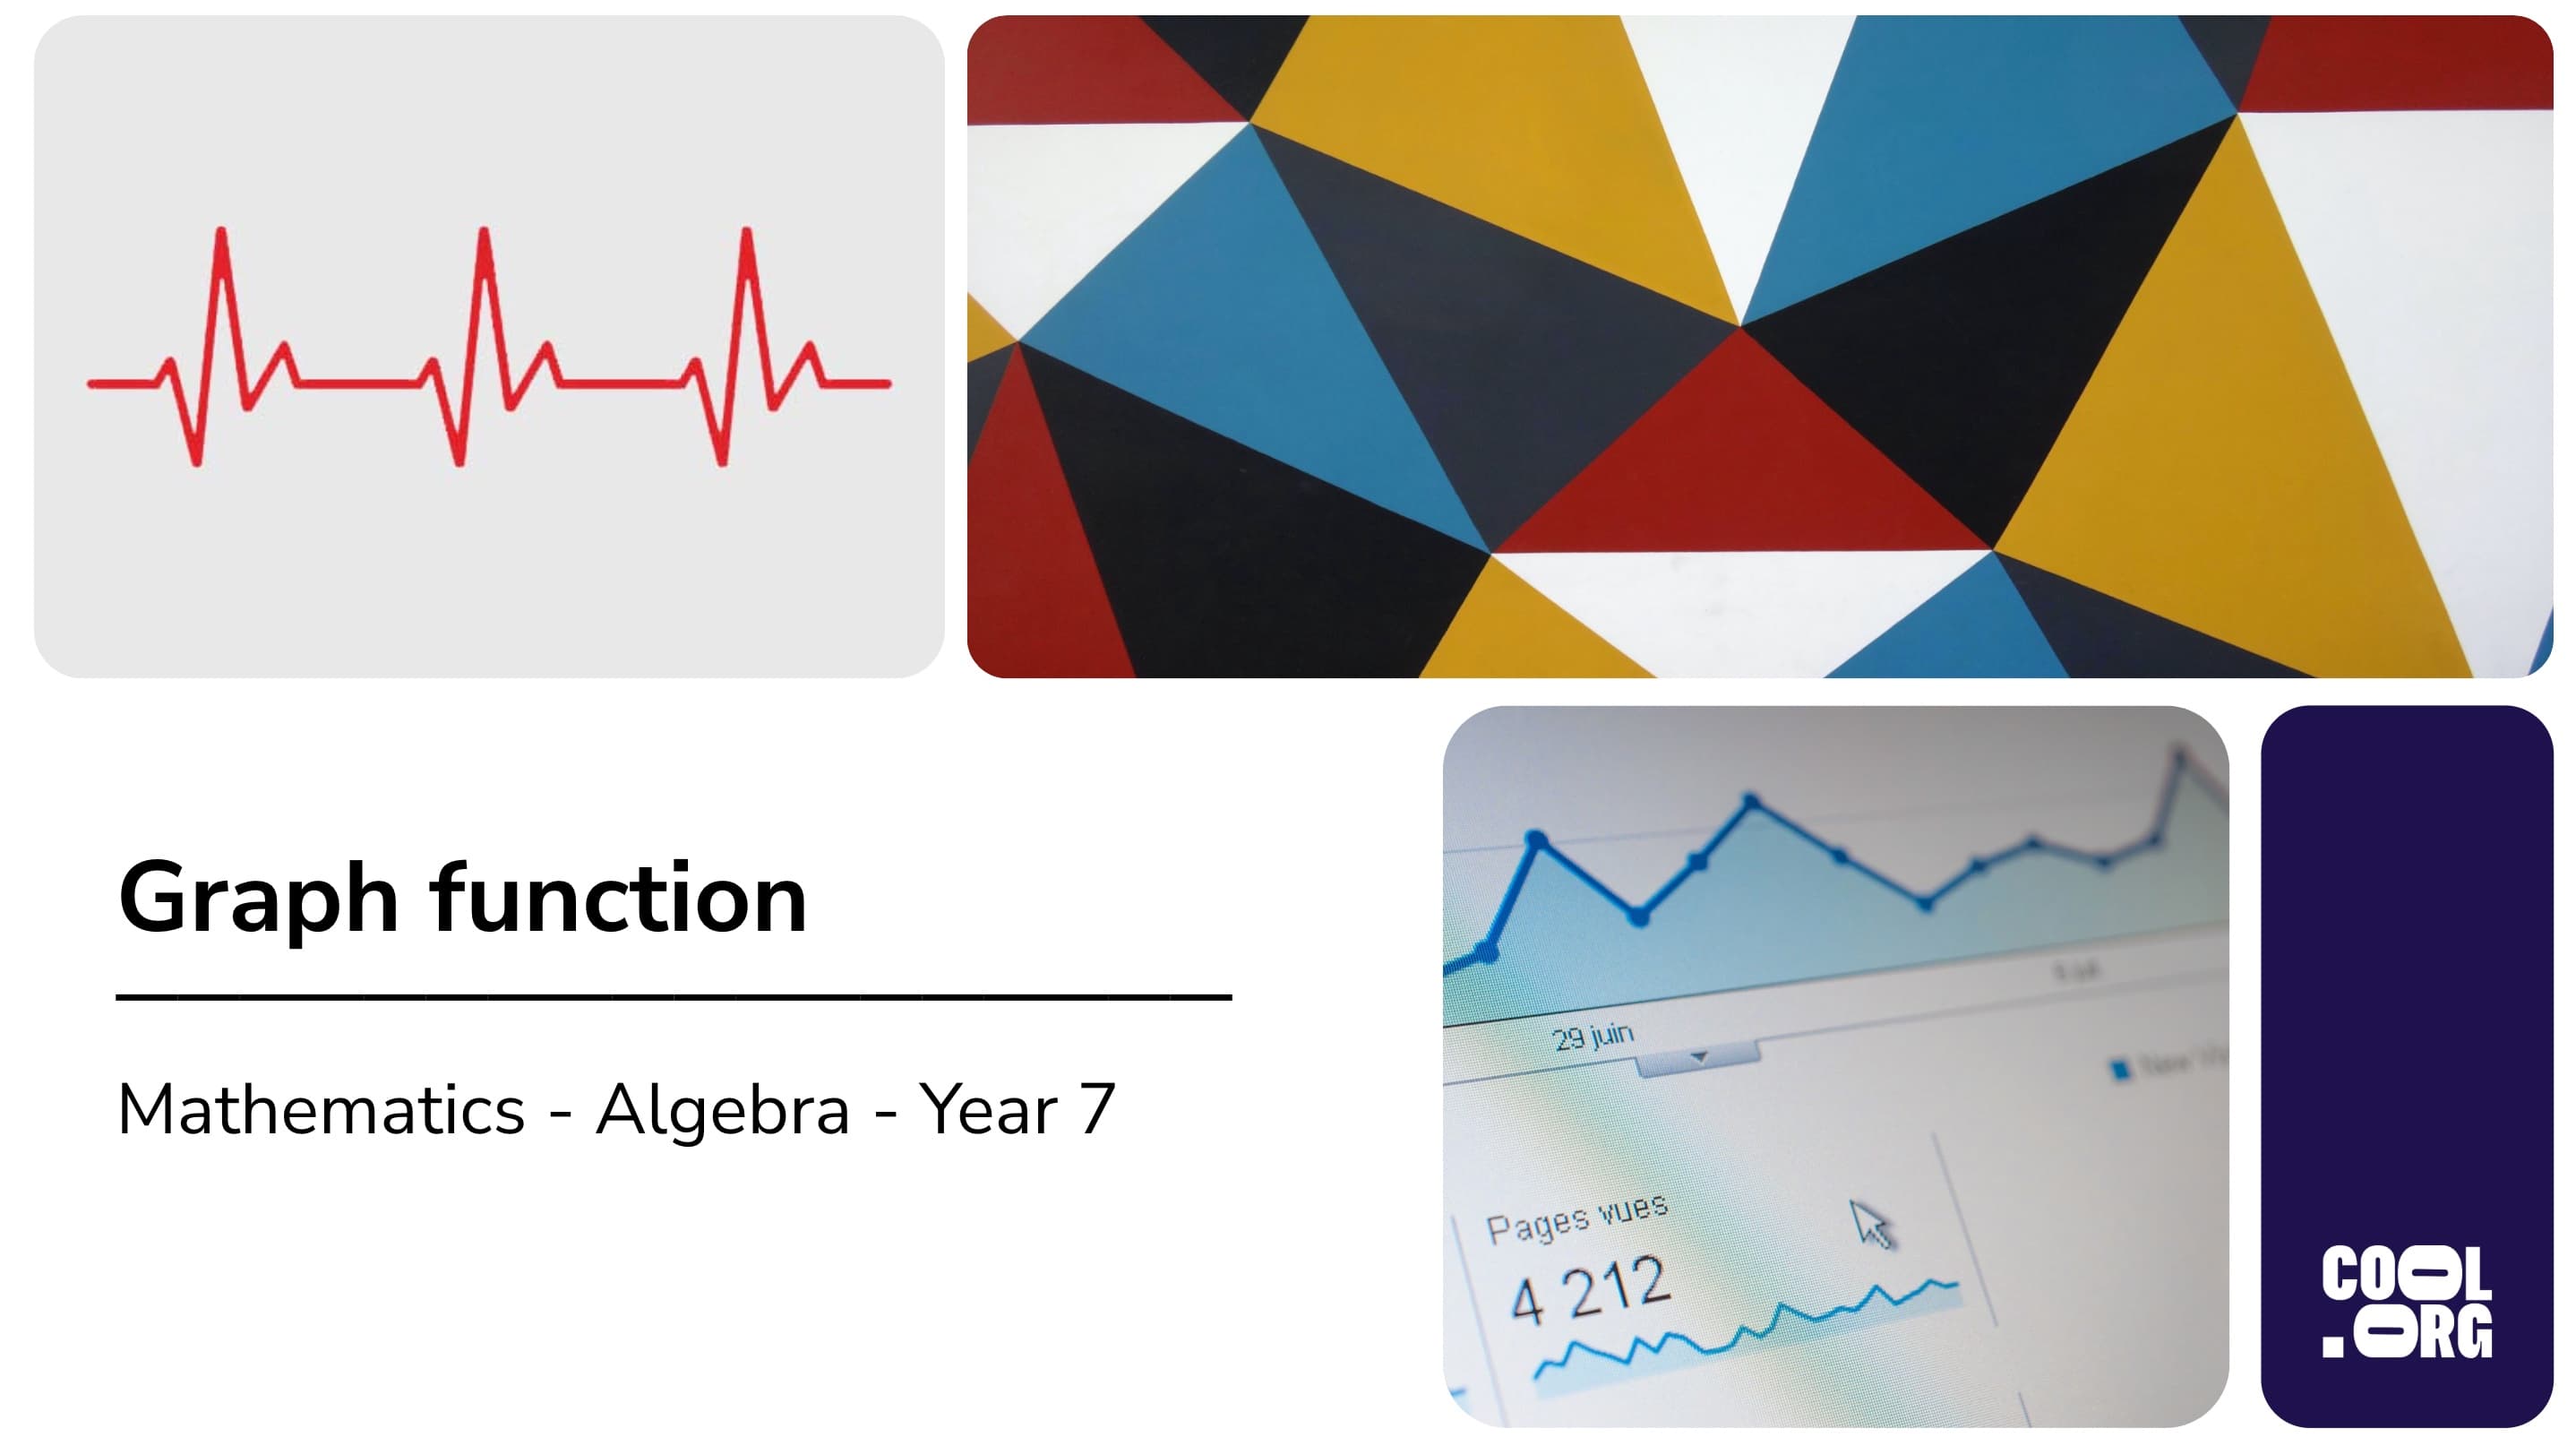
Presentation Summary
What makes a graph a good one? Graphs are a powerful way to represent information and complex data. How can they be represented and how might we make sure the information is helpful?
Accessing the file:
- Click the 'download' button and choose either Microsoft PowerPoint or Google Slides.
- Edit the presentation to suit your teaching style.
- Members must have an active Cool+ subscription to access the presentation.
- View the entire catalogue of Presentation Slides here.
Curriculum links
- Describe relationships between variables represented in graphs of functions from authentic data (AC9M7A04)
Aligned Cool.org resources
- Self-Directed Learning: Learn@Home - Angles Above
- Lesson: Outdoor Learning - Perimeter And Area in The Schoolyard - Year 8
Welcome back!
Don't have an account yet?
Log in with:
Create your free Cool.org account.
Many of our resources are free, with an option to upgrade to Cool+ for premium content.
Already have an account?
Sign up with:
By signing up you accept Cool.org's Terms and Conditions(Opens in new tab) and Privacy Policy(Opens in new tab).