Loading page...
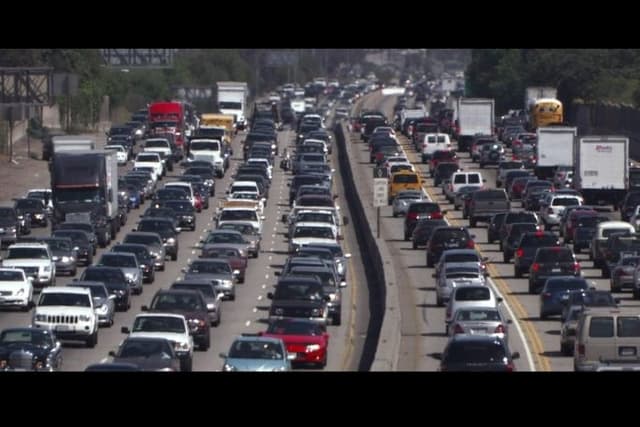
2040 - Sustainable Transport and Scatterplots
Lesson3 of 3 in this unit
SecondaryYear 9 - 10MathematicsStatisticsProbabilityEnvironmentalEnergySustainabilityEconomicDesign ThinkingIndustry, Innovation and Infrastructure
Lesson Summary
In this lesson, students will view excerpts from 2040 then access and evaluate statistical reports in the media and other places about sustainable transport of the future, and they will use the data to construct scatter plots, make comparisons and draw conclusions.
Learning intentions
Students will:
- be able to investigate statistics and examine their meaning/relevance
- be able to construct scatter plots and examine and comment upon the relationships between variables
Success criteria
Students can:
- construct scatter plots from data tables
- examine scatter plots and comment upon the relationships between variables
- create a visual product that uses statistics and scatter plots to persuade an audience to change their behaviour
Lesson Guides and Printables
Loading…