Lesson summary
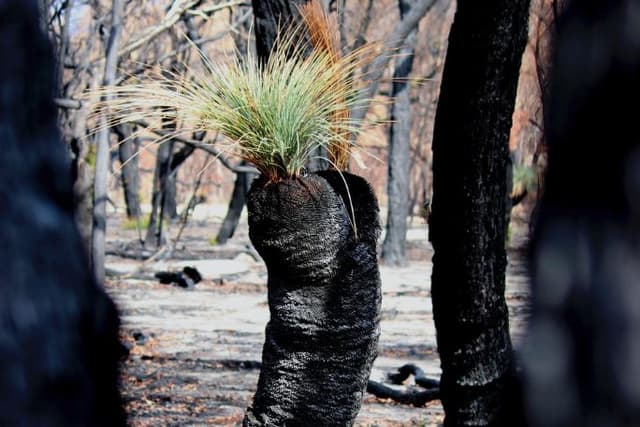
Students critically analyse image data sets to consider the changes taking place in a recovering ecosystem. Using satellite images students will record observations about changes in plant species and make predictions about changes in a range of abiotic factors. Based on the provided data students, will make a hypothesis about the recovery of populations well after a bushfire event.
Learning intentions:
Students will...
- identify biotic and abiotic elements of an ecosystem and how they change due to bushfires
- analyse data sets to determine current changes over time and predict future changes in an ecosystem recovering from bushfires
- develop a hypothesis about future ecosystem recovery based on these data sets.
- develop their observation and questioning skills
Success criteria:
Students can...
- interpret and explain changes between satellite images
- interpret data in a plot graph
- identify and discuss changes in a variety of abiotic factors
- create a hypothesis based on their interpretation of data
- identify data that would help them investigate this hypothesis.
Lesson guides and printables
Curriculum links
Select your curriculum from the options below.
Lesson details
Curriculum mapping
Australian Curriculum content descriptions:
Year 9 Science:
- Ecosystems consist of communities of interdependent organisms and abiotic components of the environment; matter and energy flow through these systems (ACSSU176)
- Formulate questions or hypotheses that can be investigated scientifically (ACSIS164)
- Analyse patterns and trends in data, including describing relationships between variables and identifying inconsistencies (ACSIS169)
Syllabus outcomes: SC5-14LW, SC5-4WS, SC5-7WS
General capabilities: Critical and Creative Thinking, ICT Capability
Cross-curriculum priority: Sustainability OI.2, OI.3
Relevant parts of Year 9 Science achievement standards: Students analyse how biological systems function and respond to external changes with reference to interdependencies, energy transfers and flows of matter. They analyse trends in data, identify relationships between variables and reveal inconsistencies in results. Students design questions that can be investigated using a range of inquiry skills.
This lesson is part of the wider unit of work Beyond the Bushfires – Secondary
Time required: 60 min
Level of teacher scaffolding: Low – Supervise student completion of the activity and facilitate discussion and reflection at the end of the lesson
Resources required
- Laptops or personal computer access
- Projector or Smart Board
- Printout of Student Worksheet – one copy for each student
Skills
This lesson is designed to build students’ competencies in the following skills:
- Creativity
- Critical thinking
- Problem solving
Additional info
In partnership with The Conversation, the Beyond the Bushfires series brings the words of scientists who are actively involved in research and science communication into classrooms throughout Australia. Students will explore evidence-based research embedded in the context of real-world practice.
Additional thanks to the Ian Potter Foundation, John T Reid Charitable Trusts and The Myer Foundation, for generously supporting the development of these lessons
Welcome back!
Don't have an account yet?
Log in with:
Create your free Cool.org account.
Many of our resources are free, with an option to upgrade to Cool+ for premium content.
Already have an account?
Sign up with:
By signing up to Cool.org you consent and agree to Cool's privacy policy to
store, manage and process your personal information. To read more, please see
our privacy policy here(Opens in new tab).