Dying to Live - Comparing Scatterplots

Dying to Live - Comparing Scatterplots

Lesson 2 of 3 in this unit

  • Secondary
  • Year 9 - 10
  • Mathematics
  • Statistics
  • Probability
  • Social
  • Disability
  • Equality
  • Mental Health
  • Physical Health
  • ...

Lesson summary

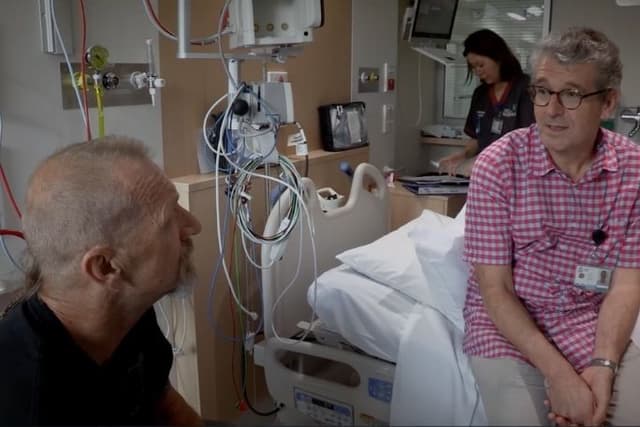
During this lesson, students will use scatterplots to investigate Australia’s organ donation and transplant data and the issues associated with this topic. They will follow the story of Allan Turner from the documentary film Dying to Live, who is raising awareness of organ and tissue donation in Australia through Zaidee’s Rainbow Foundation. Students will find trends and compare Australian organ donation and transplant rates with those of the leading country, Spain, and investigate ways that Australia could improve outcomes. Students will communicate the issue and recommend ways for Australians to save more lives through organ donation through the creation of a poster.

Learning intentions:

Students will...

  • be able to analyse and compare data using scatterplots.
  • be able to conduct research to identify trends.
  • be able to make recommendations based on data, and communicate findings effectively.
  • understand current issues associated with organ donation and transplants.

Success Criteria:

Students can...

  • understand the general process concerning organ donation and be familiar with current issues associated with organ donation and transplants.
  • develop scatterplots and identify trends.
  • conduct research to find useful and valuable information.
  • make a clear recommendation and effectively justify choices.

Lesson guides and printables

Lesson Plan
Student Worksheet
Teacher Content Info

Curriculum links

Select your curriculum from the options below.

Lesson details

Curriculum mapping

Australian curriculum content descriptions: 

Year 10 Mathematics:

  • Evaluate statistical reports in the media and other places by linking claims to displays, statistics and representative data (ACMSP253)
  • Use scatterplots to investigate and comment on relationships between two numerical variables (ACMSP251)

Syllabus outcomes: MA5.1-12SPMA5.1-2WMMA5.2-2WM

General capabilities: LiteracyNumeracyCritical and Creative Thinking

Relevant parts of Year 10 achievement standards: They compare data sets by referring to the shapes of the various data displays. They evaluate statistical reports. 

Unit of work: Dying to Live – Mathematics – Year 9 & 10 

Time required: 75 mins.

Level of teacher scaffolding: Medium – lead students through a number of short tasks and offer support when required. There is flexibility for students to work independently, or for the teacher to provide more instruction and support during each step.

Resources required

Skills

This lesson is designed to build students’ competencies in the following skills:

  • Communication
  • Collaboration
  • Creativity
  • Critical thinking

Additional info

Dying To Live is a documentary feature film that examines organ and tissue donation and transplantation in Australia through seven different stories that highlight the social, physical and emotional effects of being on the organ donor waiting list. The film also aims to dispel myths about organ and tissue donation while encouraging family conversations so that family members are aware of their loved ones’ donation intentions. Find out how to screen or view the film here.

lesson saved in resources

Save

Download

Share

More from this unit

See all
  • Lesson 1 of 3
  • Free
  • ...

Dying to Live - Real World Probabilities

  • Secondary
  • Year 9 - 10
  • Mathematics
  • Statistics
  • Probability
  • Social
  • Disability
  • Equality
  • Mental Health
  • Physical Health
  • Lesson 3 of 3
  • Free
  • ...

Dying to Live - Surveying For Trends

  • Secondary
  • Year 9 - 10
  • Mathematics
  • Statistics
  • Probability
  • Social
  • Disability
  • Equality
  • Mental Health
  • Physical Health
See all

Related content

Loading content...
Loading content...
Loading content...
Loading content...