Lesson summary
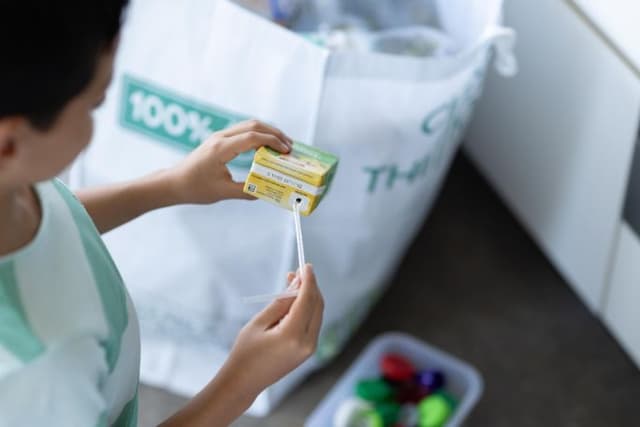
What exactly are we throwing away? Using percentages, fractions and pie charts, students will explore just what goes into our bins and how we can represent these quantities in a comparable way.
Learning intentions:
Students will...
- understand percentages.
Success criteria:
Students can...
- recognise 100% as the complete whole
- create pie chart models to represent findings and compare relative size
- connect common fractions such as ¼ and ½ to their related percentages
- estimate the percentages represented by sections of a pie chart which represent less familiar quantities.
Lesson guides and printables
Curriculum links
Select your curriculum from the options below.
Lesson details
Skills
This lesson is designed to build students’ competencies in the following skills:
- critical thinking
- collaboration
- communication
- reflection
Curriculum Mapping
Western Australian Curriculum - Year 6, Mathematics
- Make connections between equivalent fractions, decimals and percentages (ACMNA131)
- Interpret and compare a range of data displays, including side-by-side column graphs for two categorical variables (ACMSP147)
Australian Curriculum (v9.0) content descriptions - Mathematics
- Students solve problems that require finding a familiar fraction, decimal or percentage of a quantity, including percentage discounts, choosing efficient calculation strategies and using digital tools where appropriate (AC9M6N07).
- Students plan and conduct statistical investigations by posing and refining questions or identifying a problem and collecting relevant data; analyse and interpret the data and communicate findings within the context of the investigation (AC9M6ST03).
General capabilities: Critical and Creative Thinking, Ethical Understanding, Numeracy
Cross-curriculum priority: Sustainability
Relevant parts of Year 6 achievement standards: Students solve problems involving finding a fraction, decimal or percentage of a quantity and use estimation to find approximate solutions to problems involving rational numbers and percentages. They compare distributions of discrete and continuous numerical and ordinal categorical data sets as part of their statistical investigations, using digital tools.
Western Australian Curriculum - Year 6, Mathematics
UN Sustainable Development Goals
UN SDG 11: Make cities and human settlements inclusive, safe, resilient and sustainable
- Target 11.6 By 2030, reduce the adverse per capita environmental impact of cities, including by paying special attention to air quality and municipal and other waste management.
Resources Required
- Contents of a bin
- Device to display videos
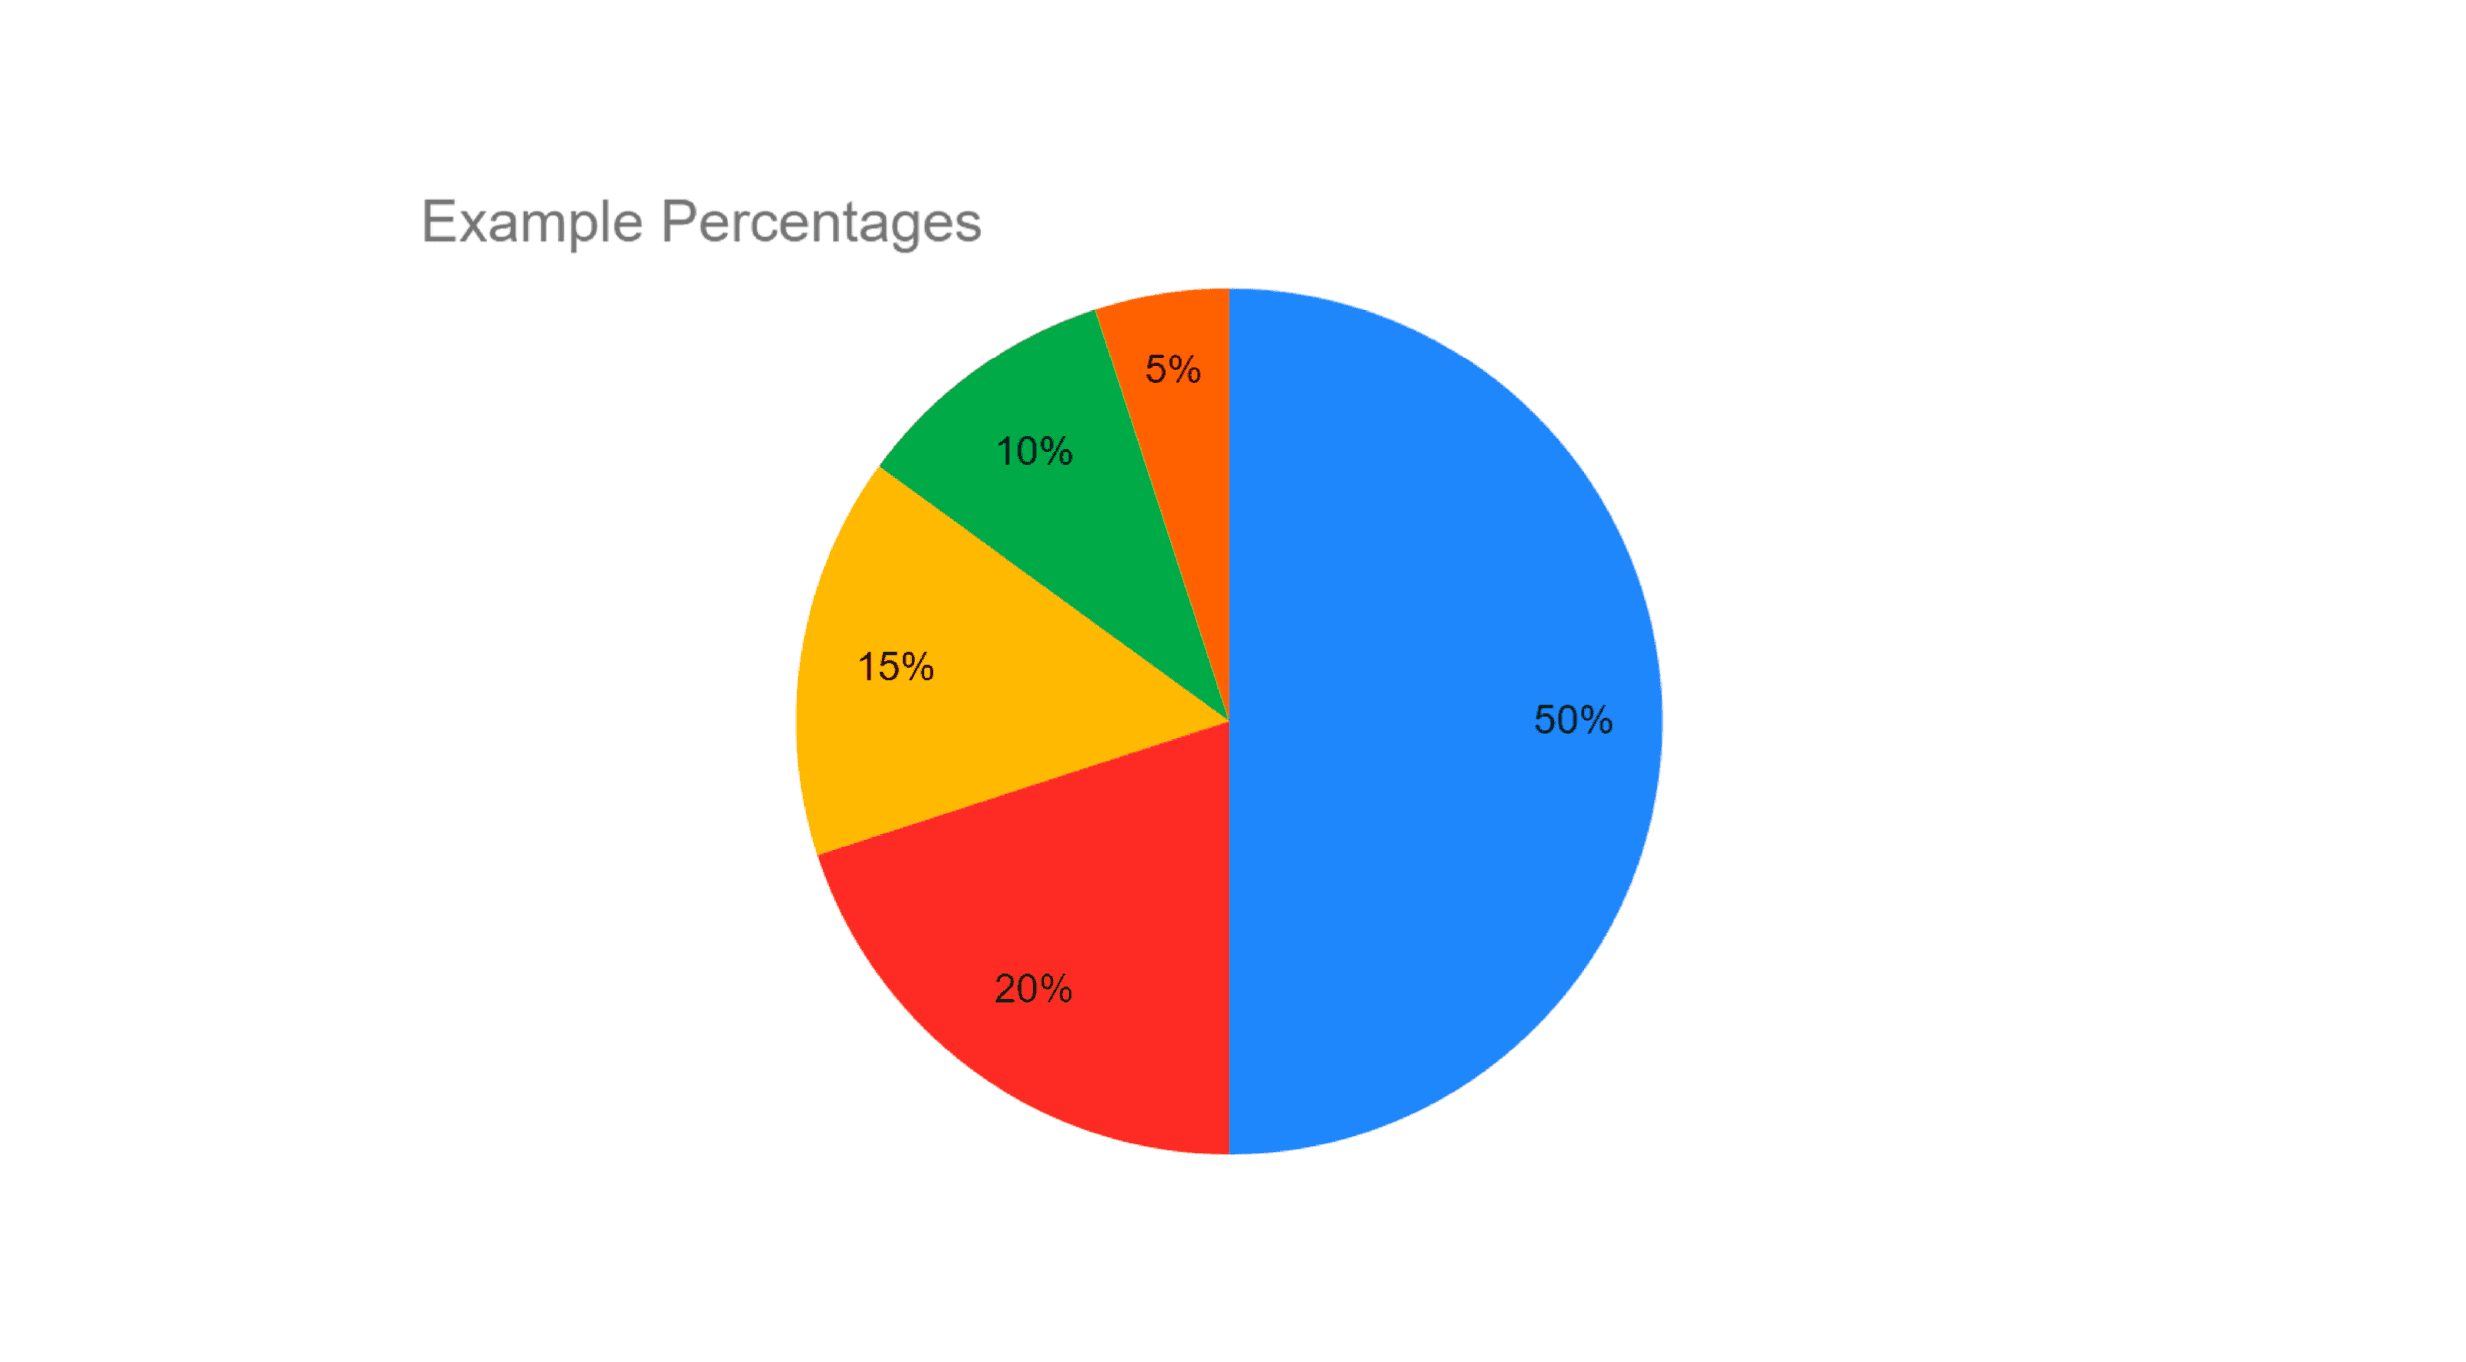
- Example percentages resource (for students who may require additional support)
- Gloves, tongs and tarp for sorting rubbish
- Butchers paper, tarp, ruler, protractor and marker
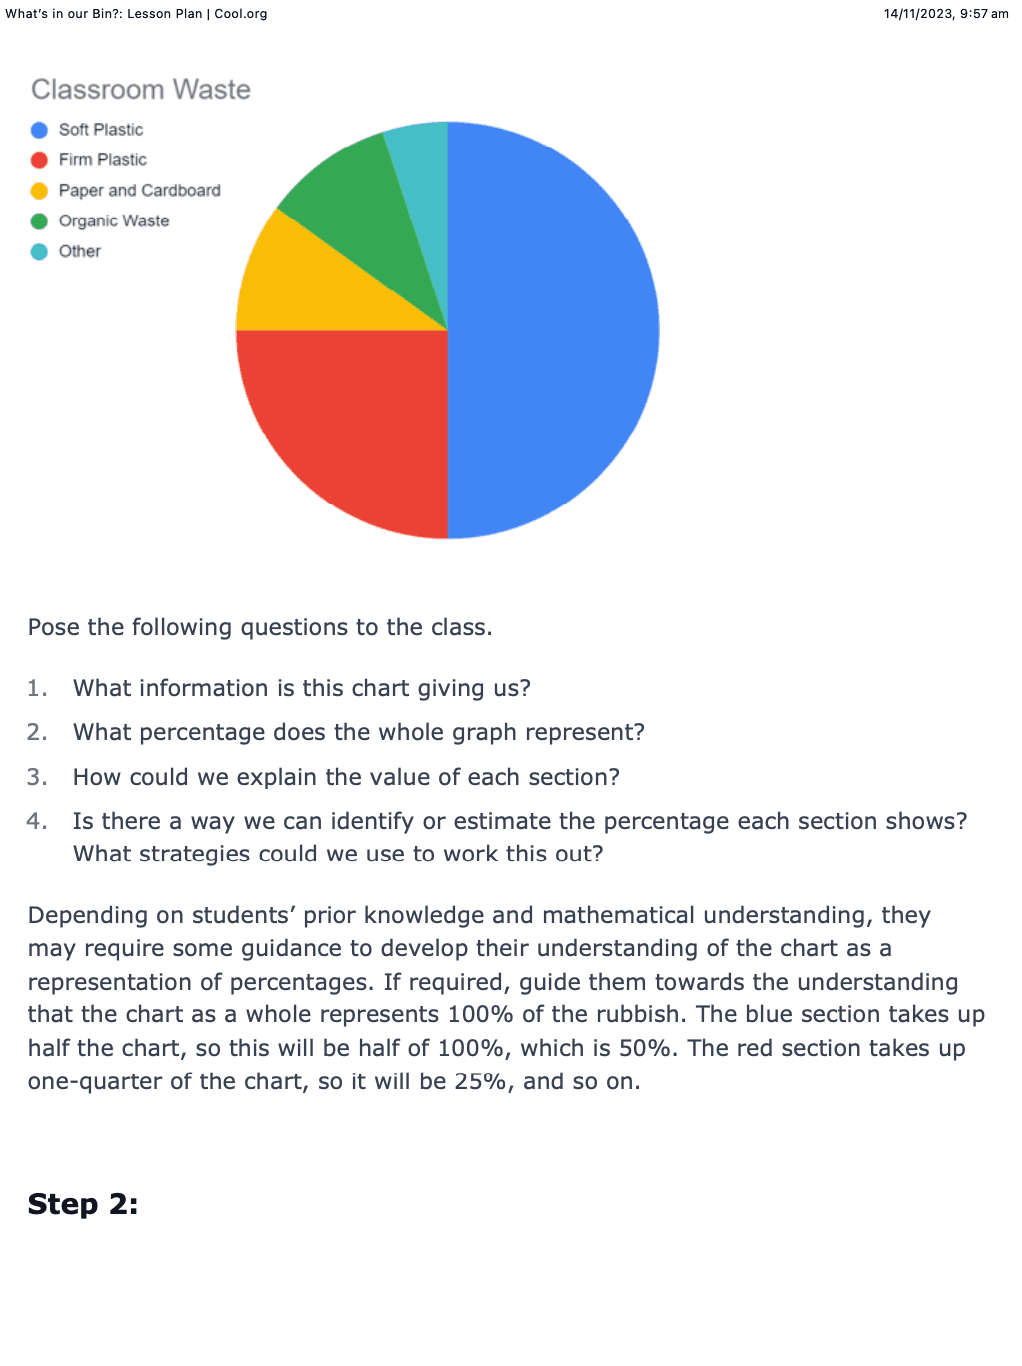
- Pie Chart Example 1 (for display to the class)
- Pie Chart Example 2 (one per student)
- Protractors and calculators (for extension activities)
Additional Info
Level of teacher scaffolding: High - direct instruction, leading of discussions, supervising waste sorting activity for safety considerations.
Welcome back!
Don't have an account yet?
Log in with:
Create your free Cool.org account.
Many of our resources are free, with an option to upgrade to Cool+ for premium content.
Already have an account?
Sign up with:
By signing up to Cool.org you consent and agree to Cool's privacy policy to
store, manage and process your personal information. To read more, please see
our privacy policy here(Opens in new tab).